In the first part of this series of articles, I described how one can create interactive plots using data returned from ChatGPT. I overlooked the validity of the returned data and focused on demonstrating how a simple prompt can give us powerful data visualisations.
In this article, I go on and create an app for interacting with our own data (uploaded via a csv file). This is achieved by utilising the LangChain pandas dataframe agent. There is no need to train on data or create complex prompts, the LangChain pandas agent does all the heavy lifting for us.
Caution: This solution works well for tabular data with numerical values. If your data is not tabular or contain much textual data, consider using embeddings, vector databases for querying and retrieving your data.
Disclaimer: The proposed solution is for demostration purposes. It has not been fully tested and there will be cases and datasets where it breaks. Use it with caution and adapt it accordingly.
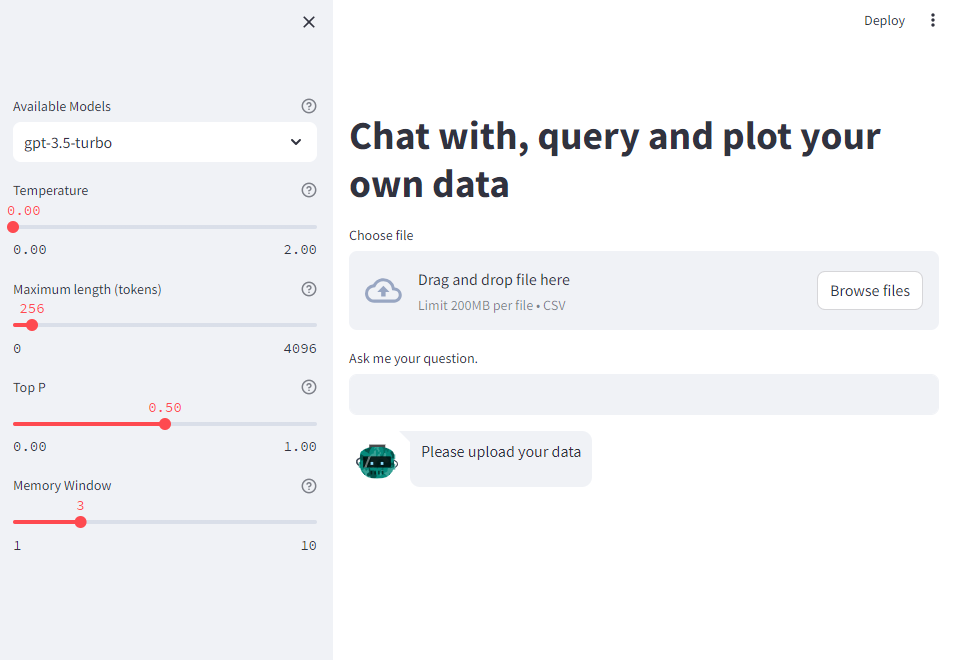
First, I created a simple chatbot, following previous work and the chatbot built for part I. The Memory window parameter controls the size of history messages that are fed into the LLM for context. Here is a screenshot of the landing page.
The dataset
We need a dataset for demonstration reasons. I use the Annual CO2 emissions from land-use change per capita dataset from “Our World in Data”. The dataset contains emission data from 1850 to 2021 of most countries. CO2 emissions of land-use change can be positive or negative depending on whether these changes emit (positive) or sequester (negative) carbon.
Download the data if you want to follow the tutorial on your local app (see the GitHub repo for instruction how to run the app locally.)
The uploaded file is read as a pandas dataframe, df, in the code below.
The LanchChain Agent
First, we need to define an LLM model object which will be passed into the agent. Then we define the pandas agent object and finally we pass the messages/queries, st.session_state.messages, from the chatbot into the pandas agent, which does all the heavy-lifiting for converting the query into valid pandas code. If return_intermediate_steps=True, the agent returns a dictionary with two keys intermediate_steps, which contains a list of all the steps performed before the agent concludes to a result, and the output key which contains the actual answer in text format. I use the content of the intermediate_steps key to display the final executed code. This way, the user can validate if the executed pandas query is correct, if not, they can refine the question.
# code extracted from the src.llm_utils.chat_with_data_api function
from langchain.agents import AgentType
from langchain.agents import create_pandas_dataframe_agent
from langchain.chat_models import ChatOpenAI

model = "gpt-3.5-turbo"
temperature = 0.0
max_tokens = 256
top_p = 0.5

# Define the LLM object
llm = ChatOpenAI(
    model=model,
    temperature=temperature,
    max_tokens=max_tokens,
    top_p=top_p,
)

# Define the pandas agent
pandas_df_agent = create_pandas_dataframe_agent(
    llm,
    df,
    verbose=True,
    return_intermediate_steps=True,  # returns intermediate steps and logic
    agent_type=AgentType.OPENAI_FUNCTIONS,
    handle_parsing_errors=False,
)

answer = pandas_df_agent(st.session_state.messages)
if answer["intermediate_steps"]:
    action = answer["intermediate_steps"][-1][0].tool_input["query"]
    st.write(f"Executed the code ```{action}```")
print(answer["output"])
The plotting feature
The plotting feature was described in part I. I will now demonstrate how it interacts with our own data.
Examples
I start by uploading the aforementioned data file. The first few queries are as follows:
- User: “Preview the first five rows of the data”
- Assistant: “Executed the code
df.head()” followed by a table of the first 5 rows, see below. The assistant not only gives the answer but also display the executed pandas code for producing the result. A familiar pandas user can recognise that the answer is correct.
Next we query some statistics of the data coverage.
- User: “How many countries are there in the data?”
- Assistant: “Executed the code
df['Entity'].nunique(). There are 218 countries in the data.” Interestingly, the LangChain agent understands that the column “Entity” holds the country information and queried it. A familiar pandas user recognises that the executed code is correct. - User: “What is the minimum and maximum year in the data?”
- Assistant: “Executed the code
df['Year'].min(), df['Year'].max(). The minimum year in the data is 1850 and the maximum year is 2021”. The code executed and answers are correct.
Next, I try a more advanced query.
- User: “What are the CO2 emissions for United States between the years 2015 and 2020?”
-
Assistant: “Executed the code
df[(df['Entity'] == 'United States') & (df['Year'] >= 2015) & (df['Year'] <= 2020)]. The CO2 emissions for the United States between the years 2015 and 2020 are as follows:”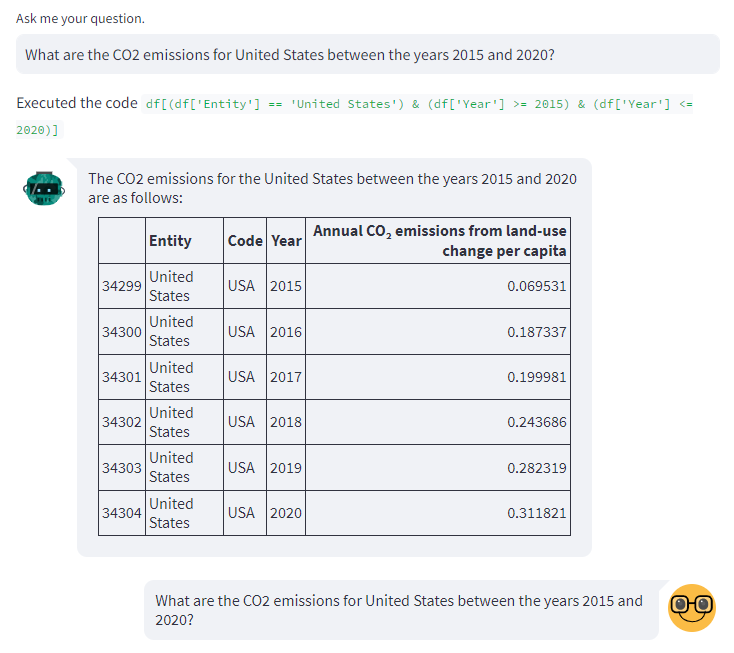
- User “Can you plot this data in a timeseries plot?”
- Assistant: “Certainly! Here’s the code to plot the CO2 emissions data for the United States between 2015 and 2020 using Plotly:”
  # Data
  years = [2015, 2016, 2017, 2018, 2019, 2020]
  emissions = [0.069531, 0.187337, 0.199981, 0.243686, 0.282319, 0.311821]

  # Create figure
  fig = go.Figure()

  # Add trace
  fig.add_trace(go.Scatter(
      x=years,
      y=emissions,
      mode='lines+markers',
      name='CO2 Emissions',
      line=dict(color='blue'),
      marker=dict(color='blue', size=8)
  ))

  # Update layout
  fig.update_layout(
      title='CO2 Emissions in the United States (2015-2020)',
      xaxis=dict(title='Year'),
      yaxis=dict(title='CO2 Emissions'),
      showlegend=True
  )

  # Show plot

  st.plotly_chart(fig, theme='streamlit', use_container_width=True)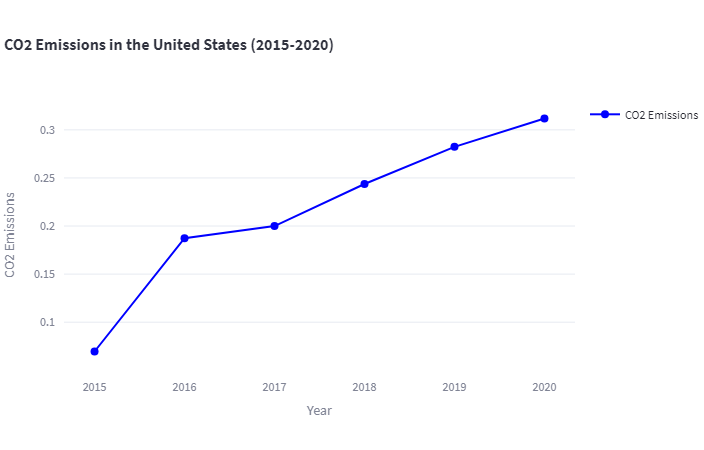
I continued testing more advanced queries, such as:
- User: “What is the average emissions between 2010 and 2020 in Germany?”
- Assistant: “Executed the code
df[(df['Entity'] == 'Germany') & (df['Year'] >= 2010) & (df['Year'] <= 2020)]['Annual CO₂ emissions from land-use change per capita'].mean(). The average emissions between 2010 and 2020 in Germany is approximately -0.1558.” An experienced pandas user recognises that this is the correct pandas query, hence result.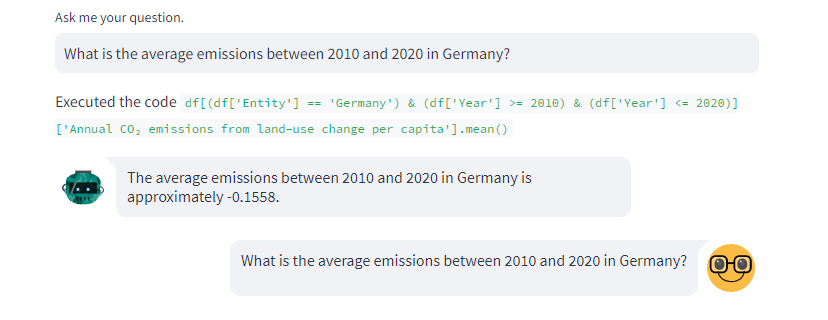
Final notes: common errors and troubleshooting
Code is not executed
Rarely, I found that the pandas agent produces the correct code, but it doesn’t execute it, therefore it doesn’t return a result. For example, in the following question:
- User: “What are the CO2 emission ratio between United States and Germany in 2018?”
- Assistant: “To calculate the CO2 emission ratio between the United States and Germany in 2018, we need to filter the dataframe for the relevant rows and then calculate the ratio.
Here’s the code to do that:
  # Filter the dataframe for United States and Germany in 2018
  filtered_df = df[(df['Entity'].isin(['United States', 'Germany'])) & (df['Year'] == 2018)]

  # Calculate the CO2 emission ratio
  us_emission = filtered_df[filtered_df['Entity'] == 'United States']['Annual CO₂ emissions from land-use change per capita'].values[0]
  germany_emission = filtered_df[filtered_df['Entity'] == 'Germany']['Annual CO₂ emissions from land-use change per capita'].values[0]
  ratio = us_emission / germany_emission

  ratio
Please note that the code assumes that the column name for CO2 emissions is “Annual CO₂ emissions from land-use change per capita”. If the actual column name is different, please replace it accordingly in the code.”
The code is correct, but it doesn’t get executed and no answer is returned.
In this case, I refined my question as follows:
- User: “What is the CO2 emission ratio between United States and Germany in 2018? Return the value of the result”
- Assistant: “Executed the code
df[(df['Entity'] == 'United States') & (df['Year'] == 2018)]['Annual CO₂ emissions from land-use change per capita'].values[0] / df[(df['Entity'] == 'Germany') & (df['Year'] == 2018)]['Annual CO₂ emissions from land-use change per capita'].values[0]. The CO2 emission ratio between the United States and Germany in 2018 is approximately -2.1965.”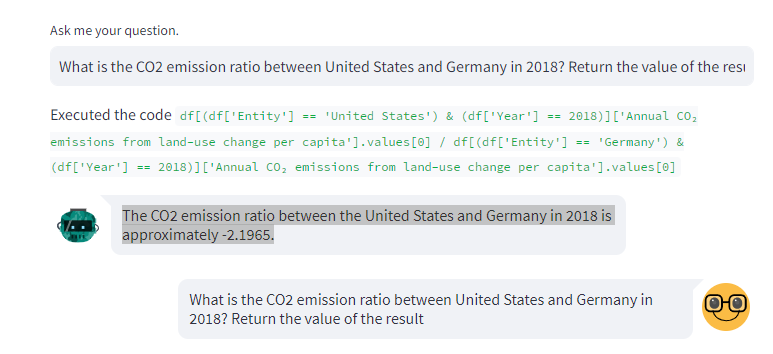
Country name varies
Another common error occurs when I queried the data of, say, the United States by asking it to return data for the US. “US” does not appear in the data, hence resulting in an error or no results. In this case, I had to refine my question and used “United States”. Another way, which scales to more solutions is to include an instruction in the system prompt, in which we explain to the LLM to treat common country abbreviations, e.g. UK, US, etc., with their full names, i.e. United Kingdom, United States, etc., respectively and vice versa.
Plot data directly
This solution does not cover prompts which ask to directly plot the data without first displaying them in separate query. This is of course doable but for demonstration reasons I kept the solution as a two-step process. The current implementation introduces the following limitation. One cannot retrieve and plot large amounts of data, e.g. say the CO2 emissions of UK, US and Germany from 1950 to 2020. This query returns a truncated result and the resulting plot displays only a small subset of the requested data.
Queries growing in size (i.e. tokens)
Each call to the LLM is limited by the maximum number of tokens. As the queries and answers grow with time, they might reach a point where the number of input tokens (messages) is greater than the maximum number set. This will result in an error.
Also, I rarely found that some questions do not return the correct result if they are asked after multiple other questions. The reason is that the history of messages also feeds into the LLM and the LangChain agent, creating noise to the latter. If the same question is asked in the beginning of the chat, the correct result is returned, due to the limited history and noise.
A solution to the these problems is to keep only the last N, where N is 2 or 3, pair of user queries and their responses in the chat history that feeds into the chat API, see the Memory window parameter.
Conclusion
I hope I showed enough examples to demonstrate the power of the LangChain dataframe agents, which in combination with the plotting feature can produce an end-to-end analytics tool for experience and non-experienced users.
Querying tabular databases is also doable and many articles have already demonstrated some use-cases. One can use the LangChain database agent, which works in similar fashion to the pandas agent. However, I personally found that it doesn’t easily apply to databases in Snowflake or BigQuery. In this case, prompt engineering comes to rescue again. A prompt with detailed description of the data schema and instructions can give very accurate SQL query strings, which are executed using the corresponding database connectors. The returned results can be plotted using the prompts and tools described in this series of articles.